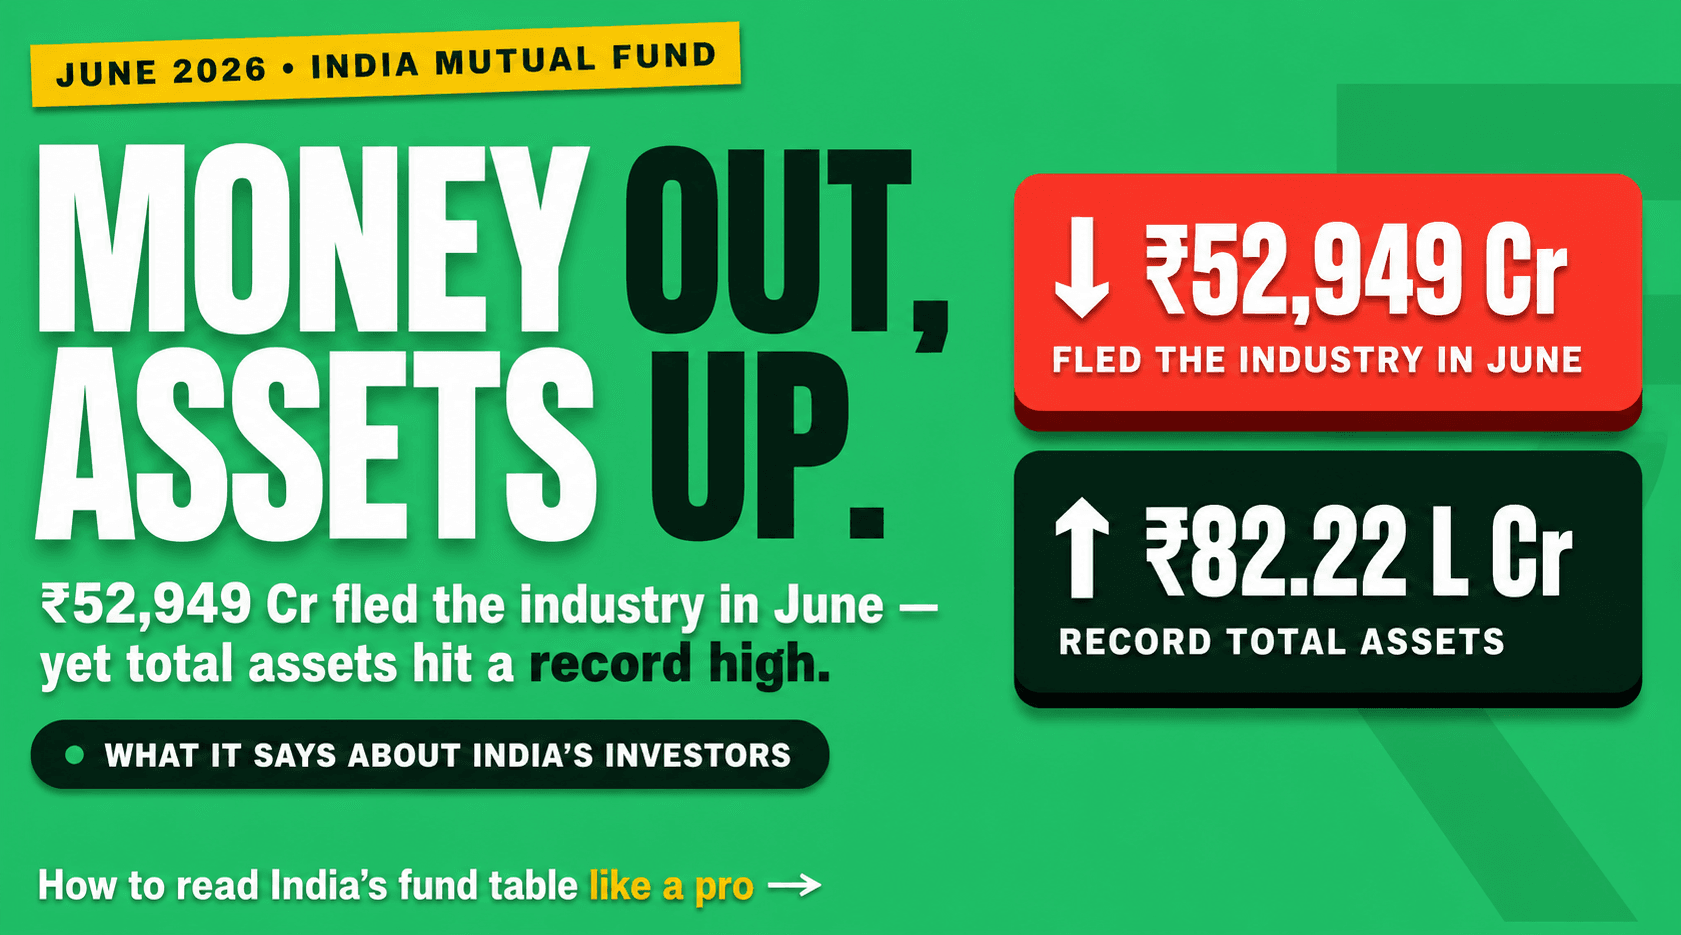
₹52,949 crore (₹529 billion) walked out of India's mutual funds in June 2026 — and the industry still ended the month ₹64,138 crore (₹641 billion) bigger. Both numbers sit in the same official table from AMFI, India's fund-industry body, and neither is a misprint. If you can explain how both are true at once, you can read fund-flow data better than most headlines do. By the end of this piece, you will.
(A quick units note for global readers: Indian finance counts in crore — 1 crore is 10 million rupees, so ₹100 crore = ₹1 billion and ₹1 lakh crore = ₹1 trillion. We quote crore first, with billions in brackets.)
One Table, Two Opposite Stories
India is the market everyone watches to see what happens when a whole country learns to invest at once, and its monthly fund report is really two reports stapled together. One tracks households drip-feeding savings into equity funds month after month. The other tracks corporate treasurers who use short-term debt funds as a parking lot for working cash. In June the two moved in opposite directions — hard.
Households pushed a net ₹28,973 crore (₹290 billion) into equity funds, up 26% on May's ₹22,908 crore. Treasurers, meanwhile, yanked ₹1.09 lakh crore (₹1.09 trillion) out of debt funds. Net the two (plus hybrids, ETFs and the rest) and you get the headline: −₹52,949 crore for the industry.
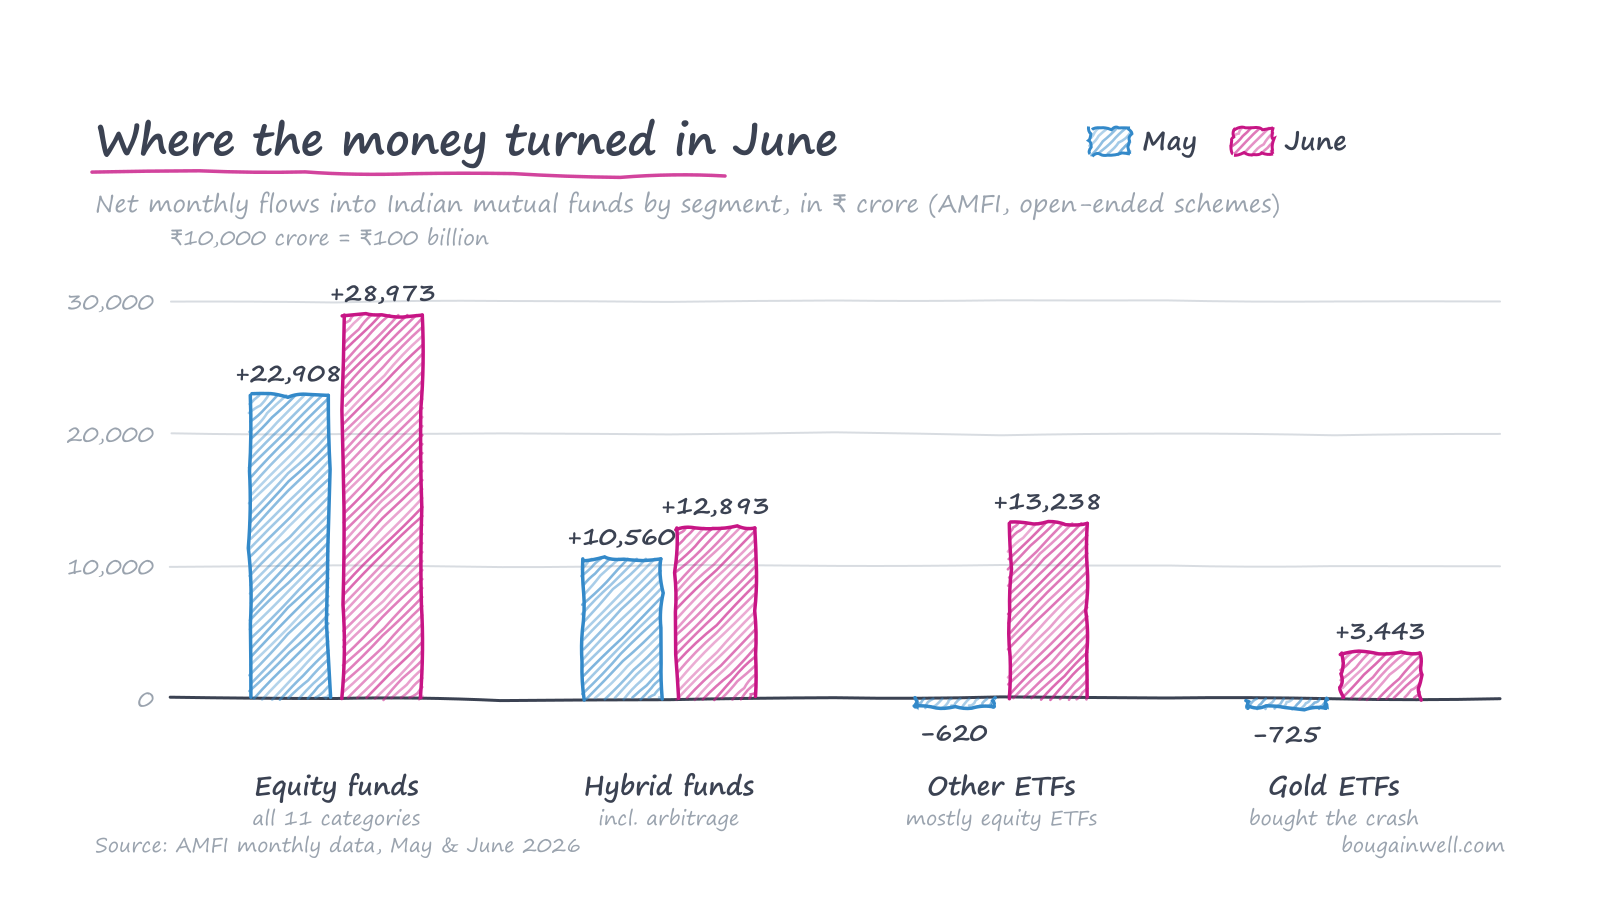 The four swings that define June: equity, hybrid, ETF and gold money all accelerated while treasury cash left. (Chart: BougainWell · Data: AMFI monthly data, May & June 2026)
And yet total assets rose 0.8% to ₹82.22 lakh crore (₹82.2 trillion). The reconciliation is simple once you see it: flows and prices are separate forces. Rising markets added roughly ₹1.17 lakh crore (₹1.17 trillion) of value to existing holdings in June — nearly double what left in cash. An industry can shrink on flows and grow on markets in the same month. Most months, price does more work than flow.
Hold on to that debt outflow, though — there's a clock hiding inside it, and we'll read it in a moment.
The Equity Engine Sped Up 26%
The equity side isn't just persistent — it accelerated across the board. Of the eleven equity categories AMFI tracks, nine took in more money than in May. The two exceptions are telling: tax-saver funds (ELSS) lost ₹634 crore — predictable, since India's tax-planning season ends in March and these funds routinely leak mid-year — and dividend-yield funds saw a rounding-error outflow.
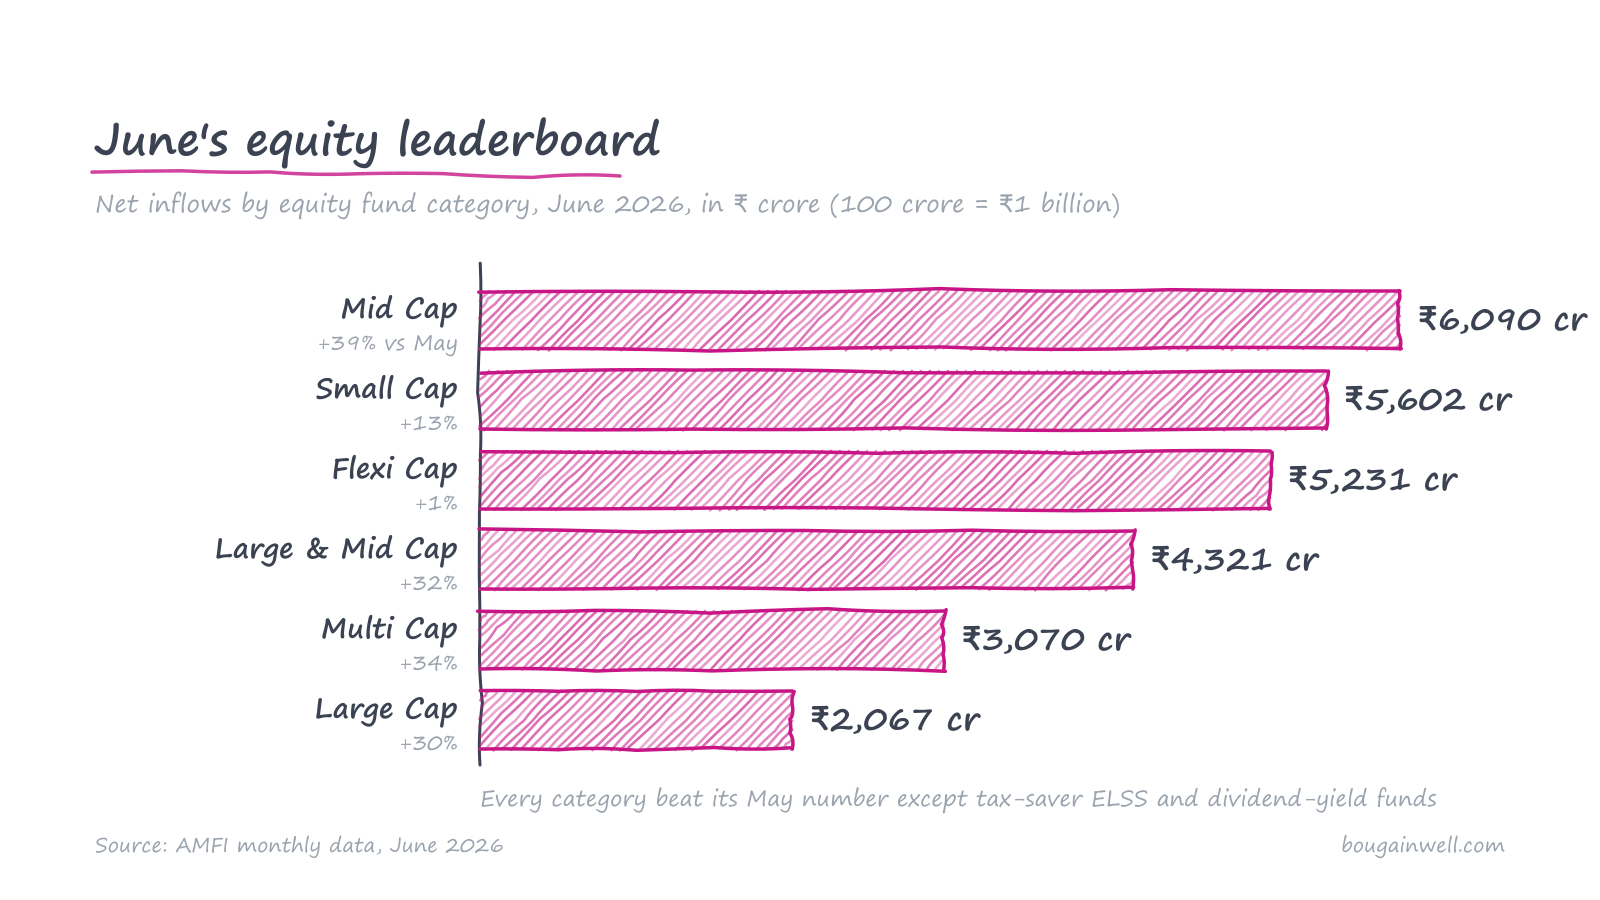 Mid- and small-cap funds — the risky end — lead the table. (Chart: BougainWell · Data: AMFI monthly data, June 2026)
Look at where the acceleration happened. Mid-cap inflows jumped 39% to ₹6,090 crore (₹61 billion); sectoral and thematic funds more than doubled, from ₹648 crore to ₹1,469 crore. The risky end of the market grew fastest — that's risk appetite deepening, not just habit continuing.
Two details make the equity number more impressive than it looks. First, it's organic: only seven new funds launched in June, raising a modest ₹460 crore between them, so this wasn't inflow manufactured by marketing blitzes. Second, it's broad: the industry added 20.3 lakh (2.03 million) investor accounts during the month. Run the arithmetic and that's about 47 new fund accounts opened every minute, around the clock, for thirty days.
Why ₹1.09 Lakh Crore Left Debt Funds (and Why Nobody Panicked)
Here's the payoff on the headline outflow. June 30 is a quarter-end — and in India, mid-June is also an advance-tax deadline for companies. Corporate treasurers pull cash out of short-term debt funds to pay taxes and to show clean cash balances on quarter-end books. It's as seasonal as the monsoon.
The data signs its own confession. Look at which debt categories bled in June:
| Debt category | June net flow | What it's used for |
|---|---|---|
| Liquid funds | −₹42,293 cr (−₹423bn) | Corporate cash parking (days to weeks) |
| Low duration | −₹16,484 cr (−₹165bn) | Corporate cash (months) |
| Ultra short duration | −₹11,426 cr (−₹114bn) | Corporate cash (weeks to months) |
| Money market | −₹10,595 cr (−₹106bn) | Corporate cash (up to a year) |
| Overnight funds | −₹10,580 cr (−₹106bn) | Cash parked literally overnight |
The shorter the parking meter, the bigger the outflow — while genuinely long-term debt categories barely moved (credit-risk funds, the boldest corner of the debt market, actually took in money both months). That pattern is treasury logistics, not fear. Watch for most of this money to file back in during July, as it does at the start of nearly every quarter.
The Gold Paradox: Buying the Worst Month in Years
June was brutal for gold globally — one of its sharpest monthly slides in years as rate expectations shifted. You can see the damage in the Indian data: gold ETF assets fell from ₹1.85 lakh crore to ₹1.70 lakh crore, an 8% drop in a single month.
Now the twist: while the value of gold ETFs was collapsing, Indian investors poured a net ₹3,443 crore (₹34 billion) in — after having pulled money out in May, when prices were near their highs.
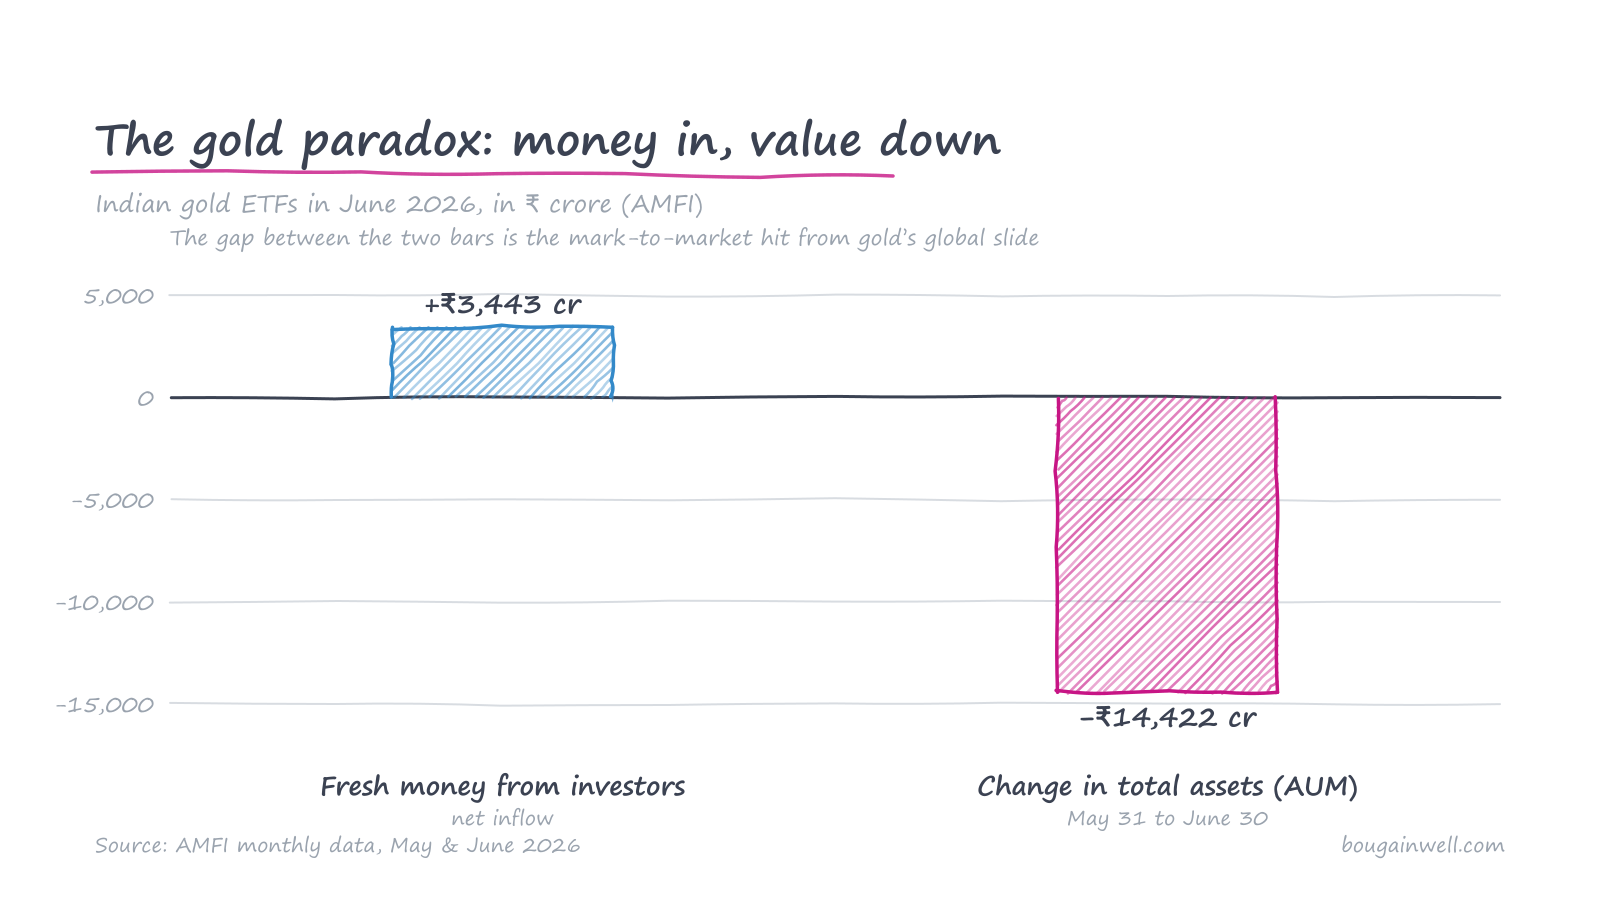 Fresh money flowed in while total value fell — the gap is the mark-to-market hit. (Chart: BougainWell · Data: AMFI monthly data, May & June 2026)
Put the two AMFI numbers together and the maths gets stark: assets fell ₹14,422 crore despite ₹3,443 crore arriving, which means the mark-to-market hit on holdings was roughly ₹17,900 crore (₹179 billion) — about 10% of the fund pool's value, gone in one month. And the response of Indian investors was to buy more. Sell high in May, buy the crash in June: that's textbook contrarian behaviour showing up in aggregate national data. The dip-buying reflex that equity SIP culture built over a decade appears to have migrated to gold.
The ₹13,238 Crore ETF Mystery
One more line deserves your eyebrow. "Other ETFs" — mostly equity index ETFs — swung from a ₹620 crore outflow in May to a ₹13,238 crore (₹132 billion) inflow in June, while ordinary index mutual funds stayed flat. Retail money doesn't move like that; it drips in smoothly through monthly plans. Money that arrives in one giant lump, in the exchange-traded wrapper that big institutions prefer, is almost certainly institutional allocation. If it repeats in July, something structural is shifting toward passive vehicles; if it doesn't, June was a one-off rebalancing. Either way, it's the line to watch in next month's table.
What to Take Away
- Headline "outflows" rarely mean investors are fleeing. June's −₹52,949 crore total concealed +₹28,973 crore of equity buying. Always split retail money from corporate treasury money before drawing conclusions.
- Quarter-end months always distort debt flows. June, September, December and March will show scary debt outflows in India; compare them to other quarter-ends, not to the month before.
- Flows and prices are separate forces. The industry lost money on flows and still grew ₹64,138 crore because markets added ~₹1.17 lakh crore of value. Decompose the two every time.
- Dip-buying has spread beyond stocks. Indians sold gold ETFs near May's highs and bought ₹3,443 crore worth into a ~10% June collapse — contrarian discipline, visible at national scale.
- A number worth remembering: India opened about 47 investment accounts per minute in June — a live view of what mass financialization of savings looks like.
Charts: BougainWell, built from AMFI's official monthly data for May and June 2026. This article is for general information only and is not investment advice.
Sources
All analysis and opinions in this article are BougainWell's own.