In July 2026, a net ₹2.36 lakh crore went into India’s mutual funds. In August, the same number was ₹41,354 crore. That is a fall of 82% in one month.
It sounds like something broke. Nothing did. The money that ordinary savers put in actually went up in August. The number that collapsed belongs to a completely different kind of investor — and once you can tell the two apart, the monthly fund report stops being confusing forever.
(1 crore = 10 million. So ₹1 lakh crore = ₹1 trillion, about $11 billion. We use crore, as the official data does.)
There Are Two Kinds of Money in This Table
Think of India’s mutual fund industry as one building with two doors.
Through the first door walk ordinary people. They put in a fixed amount every month from their salary, mostly into equity funds. Call it salary money. It is slow, steady and boring.
Through the second door walk company finance teams. A business with ₹500 crore of spare cash parks it in a short-term debt fund for a few weeks, then pulls it out to pay a bill or a tax instalment. Call it parking money. It is huge, and it comes and goes.
The monthly headline adds both together. That is why the headline is almost useless on its own.
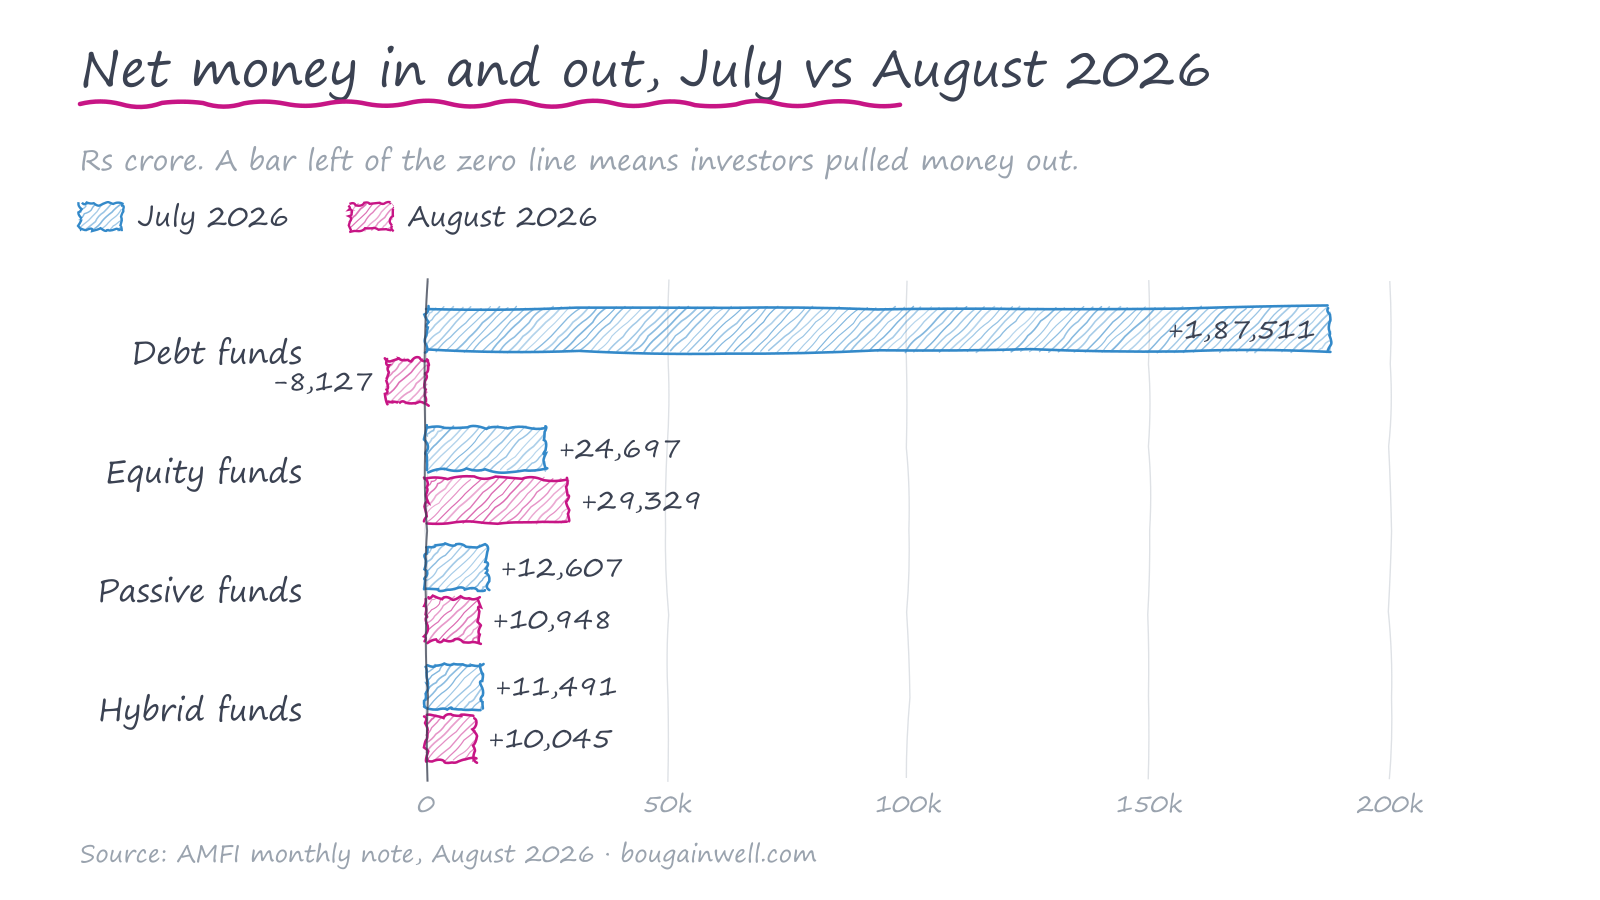 One bar explains the whole 82% drop. Everything else barely moved. (Chart: BougainWell · Data: AMFI monthly note, August 2026)
Look at the chart. Equity, hybrid and passive barely move between the two months. Only the debt bar changes — and it changes enormously.
The ₹1.96 Lakh Crore Swing That Has Nothing to Do With You
Debt funds took in ₹1,87,511 crore in July. In August they gave back ₹8,127 crore. That is a swing of about ₹1.96 lakh crore in a single month.
The debt column alone moved more than the industry’s entire total. Delete every other category and the headline barely changes.
Two sub-categories do most of the damage:
| Where the parking money sat | July 2026 | August 2026 |
|---|---|---|
| Overnight funds (cash for a day or two) | +₹40,413 cr | −₹30,654 cr |
| Liquid funds (cash for days to weeks) | +₹1,19,066 cr | +₹19,934 cr |
| Money market funds (cash for a few months) | +₹21,180 cr | +₹11,735 cr |
These are not investments in the normal sense. They are cash management. July was a month when a lot of corporate cash came in; August was a month when a chunk went back out. Neither says anything about whether Indians are confident about the stock market.
The Part That Is About You: Equity Buying Sped Up
Now the first door. Net money into equity funds rose from ₹24,697 crore in July to ₹29,329 crore in August — up nearly 19%. That is the 66th month in a row with money going in. Five and a half years, without a single negative month.
August was not a calm month. Markets were watching trouble in West Asia and disruption to shipping through the Strait of Hormuz. Big institutions kept buying anyway — foreign investors put ₹29,631 crore into Indian shares, up from ₹20,200 crore in July; domestic institutions ₹58,268 crore, up from ₹35,099 crore.
Ordinary investors did not wait to see how the news ended. They kept buying. That is the most important behavioural fact in this data.
Where the Equity Money Went — and Why to Pause Here
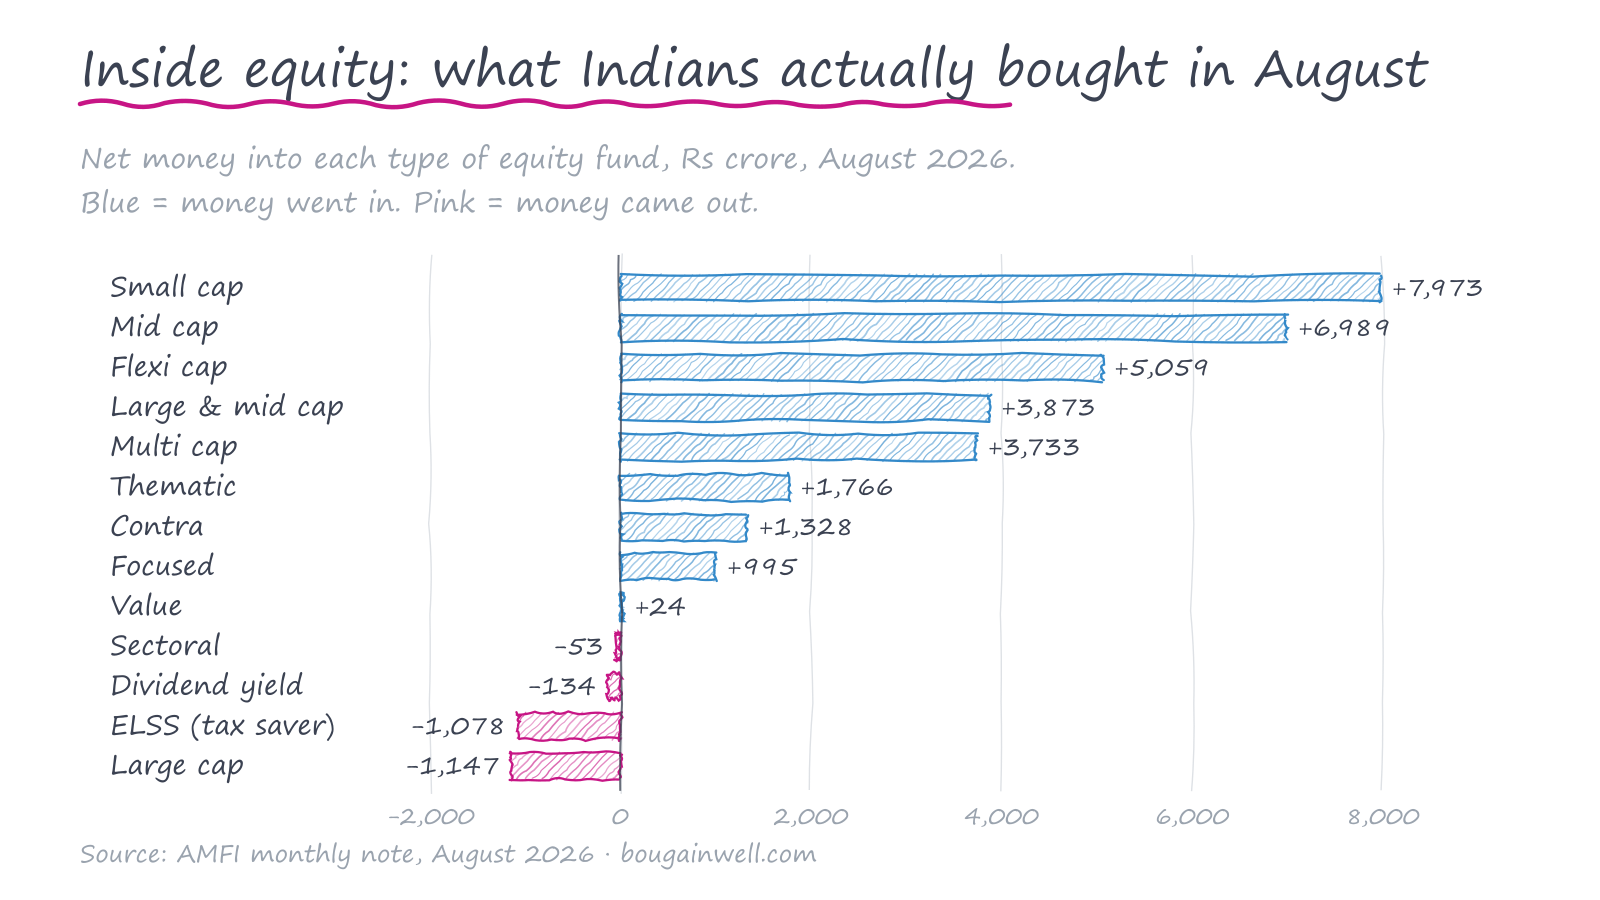 Money is flowing to the riskier end of the market, and out of the safest end. (Chart: BougainWell · Data: AMFI monthly note, August 2026)
Small-cap funds took the most money: ₹7,973 crore. Mid-cap funds took ₹6,989 crore and flexi-cap funds ₹5,059 crore. Those three alone are about 68% of everything that went into equity funds.
Now look at the bottom of the chart. Large-cap funds lost ₹1,147 crore — the second month in a row that money left them, after ₹1,322 crore in July.
In plain terms: small-cap funds buy small companies — they can rise faster and fall much harder. Large-cap funds buy India’s biggest, steadiest companies. In August, savers pushed money toward the fast end and away from the steady end.
One bar looks alarming but is not: tax-saver (ELSS) funds lost ₹1,078 crore. These get bought in a rush every January to March, when people are saving tax, and leak quietly the rest of the year. It is a calendar, not a verdict.
The Most Boring Number in the Report Is the Most Important One
SIPs — Systematic Investment Plans — are standing instructions. A fixed amount leaves your bank account on a fixed date every month and buys fund units. No decision, no timing, no news.
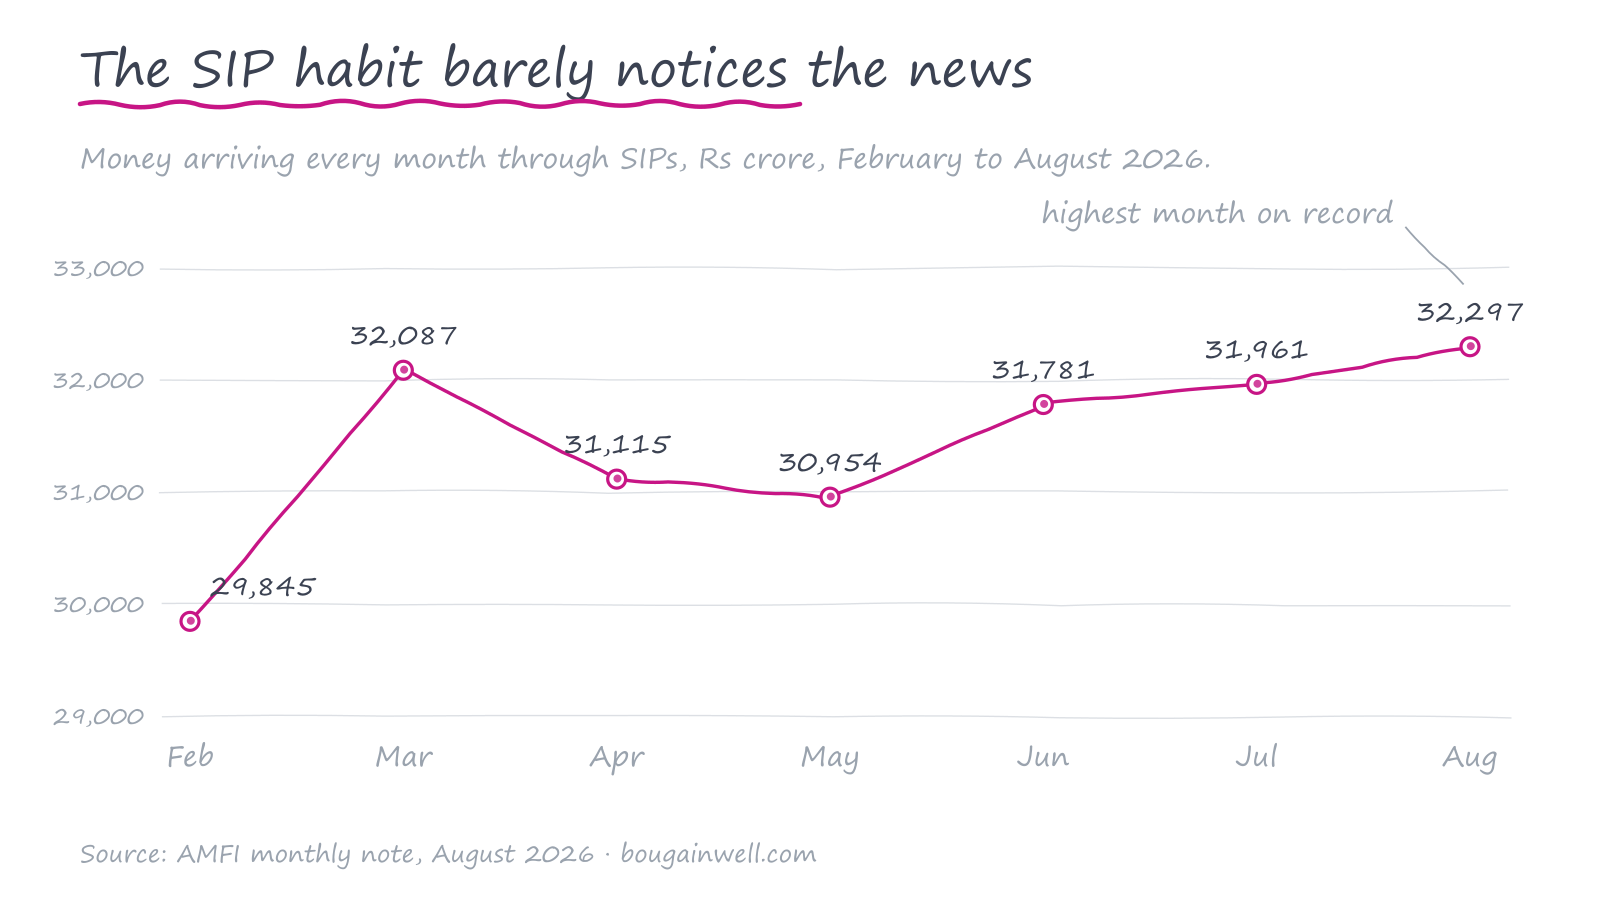 The line barely reacts to anything. That is the whole point of it. (Chart: BougainWell · Data: AMFI monthly note, August 2026)
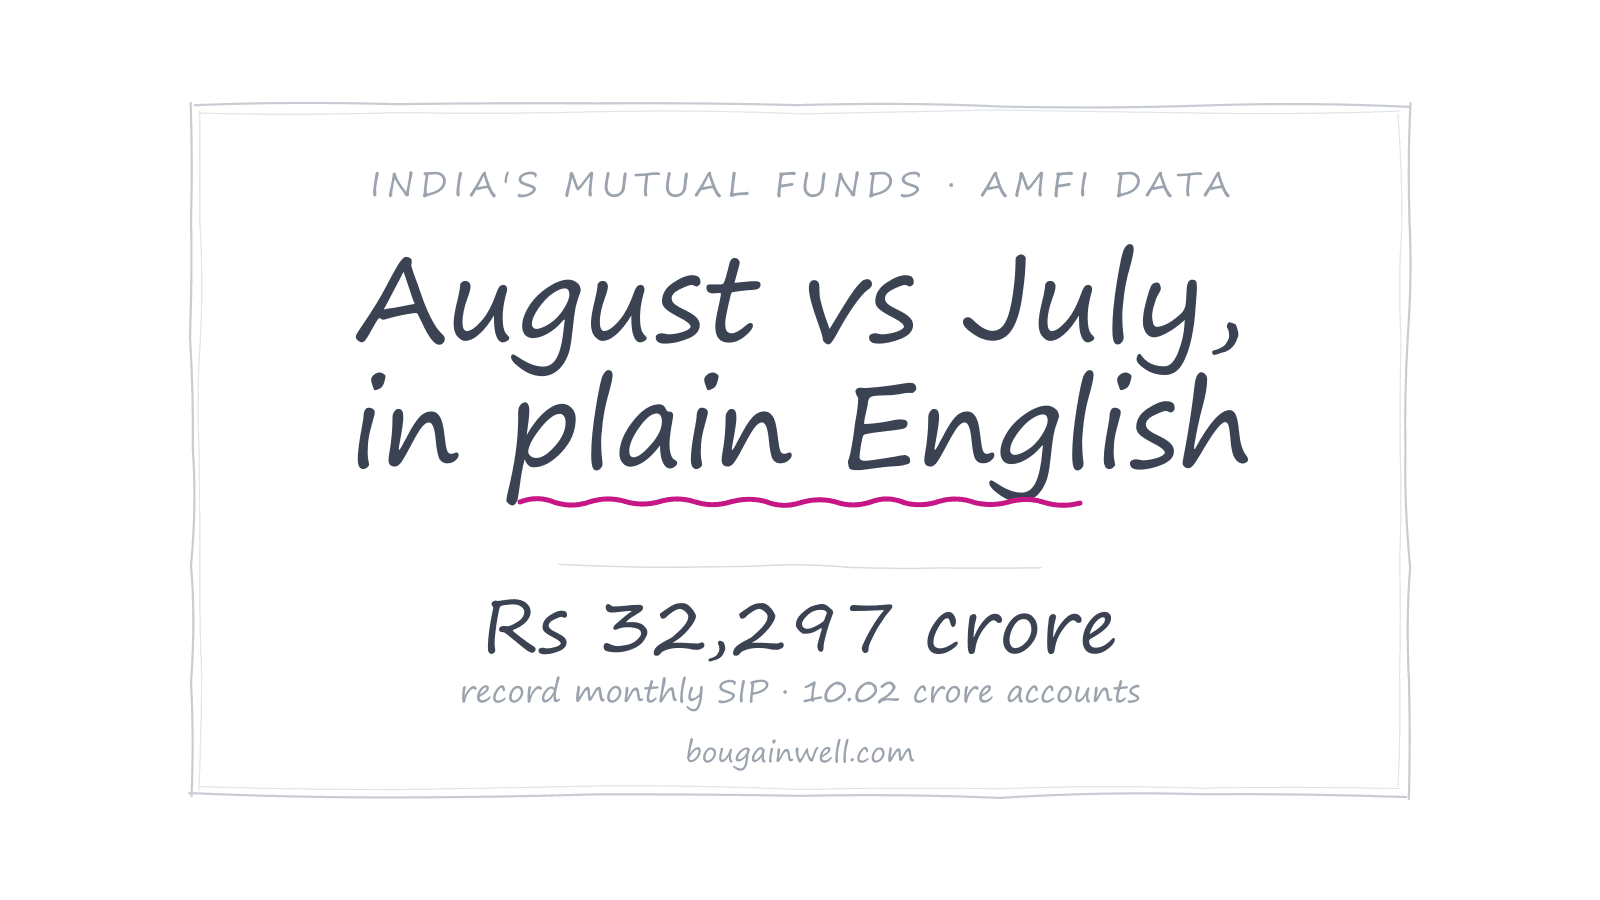
August’s SIP figure was ₹32,297 crore, the highest month AMFI has recorded, and 14.3% more than a year ago. The number of active SIP accounts crossed 10 crore for the first time — 10.02 crore, up about 12 lakh accounts in one month.
Here is the arithmetic that makes it real. Divide ₹32,297 crore by 10.02 crore accounts and the average SIP is about ₹3,223 a month — roughly a phone bill and a dinner out. Ten crore of those, added up, is now the most reliable source of money the Indian stock market has.
SIP money has built up to ₹18.62 lakh crore, which is 21.4% of everything the industry manages. More than one rupee in five now arrives on autopilot.
Why Assets Hit a Record Even Though Flows Fell
Now the loop closes. Total industry assets rose from ₹85.76 lakh crore to ₹87.08 lakh crore — an increase of ₹1,32,231 crore.
But only ₹41,354 crore of that was new money. So where did the other ₹90,877 crore come from? Prices. Existing investments simply became worth more.
That is about 69% of August’s growth coming from markets rising, not from anyone investing anything. This is the most misread part of fund data. Assets can hit a record in a month when flows collapse, and assets can fall in a month when everyone is buying. Flows and prices are two separate engines.
The Quiet Side Story: Gold and Silver
Money into gold ETFs rose from ₹1,559 crore in July to ₹2,597 crore in August, up two-thirds; silver ETFs took ₹1,271 crore. Gold ETF assets are now 163.7% higher than a year ago.
So the same month saw Indians buying more small-cap funds and more gold — growth with one hand, insurance with the other. When the news is loud, that is a reasonable pair of instincts.
What to Take Away
- The headline flow number is mostly corporate cash. Before reacting to "inflows crash 82%", check the debt row — in August it explained the entire drop.
- Judge household behaviour by two numbers only: equity net flow (₹29,329 crore) and SIP contribution (₹32,297 crore). Both rose in August.
- Assets rising is not the same as people investing. In August, roughly 69% of the increase in industry assets came from prices, not from new money.
- Watch which equity funds get the money, not just how much. Small and mid caps took the most in August while large caps lost money for a second month. That is risk appetite rising — be deliberate about it.
- The average SIP is about ₹3,223 a month. India’s market is not held up by big investors writing big cheques. It is held up by 10 crore small standing instructions.
Charts: BougainWell, built from AMFI’s official monthly note for August 2026. This article is for general information only and is not investment advice.
Sources
- AMFI — official industry data
- AMFI Monthly Note — August 2026 (PDF)
- AMFI Monthly Note — July 2026 (PDF)
All analysis and opinions in this article are BougainWell’s own.