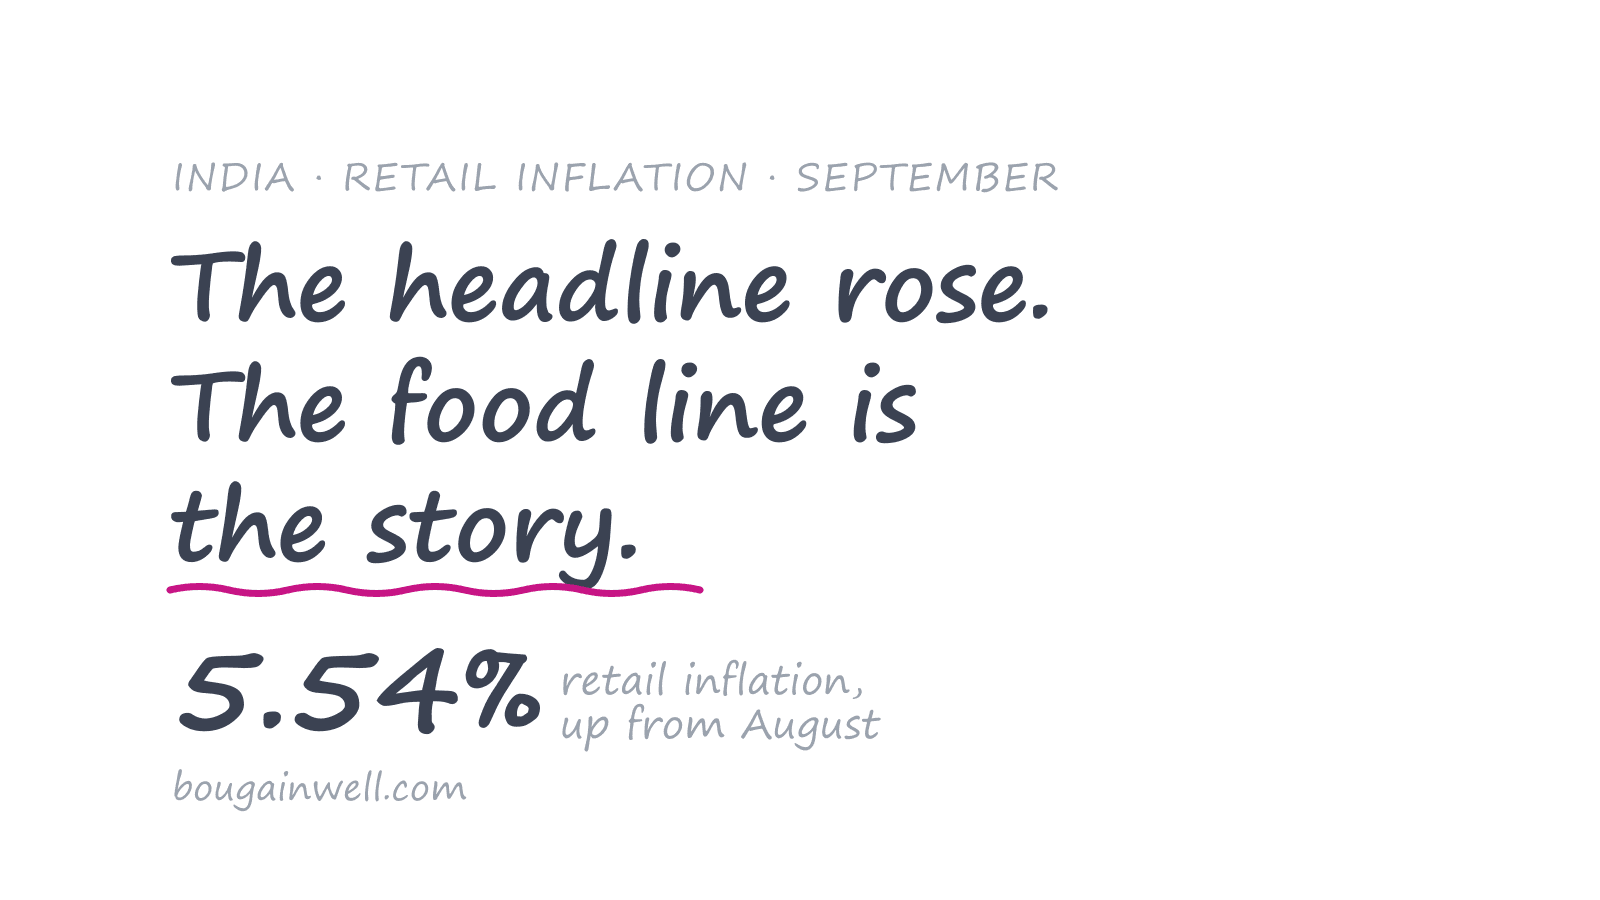
India's retail inflation came in at 5.54% for September, up from 4.83% the month before. That is the headline the wires carried on 12 October. The number under it matters more: food inflation ran at 7.74%, and food is what most Indian households actually feel.
India’s CPI inflation rises to 5.54% in September 2026, up from 4.83% in August, according to government data.
— ANI (@ANI) October 12, 2026
Food inflation climbs to 7.74%, from 5.97% in August. pic.twitter.com/uH7bYAU9kF
What the print actually says
Strip it to the two lines that matter. According to the released government data, headline CPI inflation rose from 4.83% in August to 5.54% in September. Over the same stretch, food inflation climbed from 5.97% to 7.74%.
So the whole inflation basket got about three-quarters of a percentage point hotter in a single month, while the food slice got close to two percentage points hotter. Food moved roughly two and a half times as much as the headline it sits inside.
Why the gap between the two numbers is the news
Headline CPI is a weighted average of everything a household buys — rent, fuel, transport, clothing, healthcare, food. Food is only one slice of that basket, but it is a heavy slice, and in India it is the slice that swings. When food runs at 7.74% while the all-items figure is 5.54%, the arithmetic is telling you something plain: the rest of the basket is cooler than food, and food is doing most of the lifting on the headline.
That is the difference between a broad inflation problem and a concentrated one. A broad problem shows up everywhere at once. A concentrated one shows up on the kitchen table first. September's print reads as the second kind.
Why a food-led spike behaves differently
Food-driven inflation and demand-driven inflation are not the same animal, and they do not call for the same response.
Food prices in India lean heavily on supply — the monsoon, the harvest calendar, how a few perishable crops come to market. Those forces tend to be sharp and reversible: a bad few weeks can push a line up fast, and a good arrival season can pull it back down just as fast. Demand-driven inflation, the kind that comes from too much money chasing too few goods across the whole economy, is slower to build and slower to shake.
The practical read for anyone watching the data: a jump that is mostly food is worth less alarm than the same jump spread evenly across the basket — but it is worth more attention to the household, because food is non-negotiable spending. You can defer a phone upgrade. You cannot defer dinner.
Who feels 7.74% food inflation
A headline number is an average across the whole country and every income level. Food inflation is not felt as an average. The lower a household's income, the larger the share of its budget that goes to food — so a food line running well above the headline lands hardest on the households with the least room to absorb it.
That is the quiet asymmetry inside a print like this. The 5.54% figure is the one that makes the headline. The 7.74% figure is the one that changes what a family puts in the basket at the end of the week — and when the food line eats a bigger share of the monthly budget, it is the discretionary rupee that gets squeezed, the same rupee that shows up in India's mutual fund flow data.
What to Take Away
- The headline rose, but the food line is the story. CPI inflation went from 4.83% in August to 5.54% in September; food inflation went from 5.97% to 7.74% — moving far harder than the all-items figure it sits inside.
- A food-led spike is a concentrated problem, not a broad one. The rest of the basket is cooler than food, which means the pressure is coming from a specific place rather than from the whole economy at once.
- Supply-driven food inflation tends to be sharp and reversible — unlike demand-driven inflation, which builds and fades slowly. That changes how you should weigh a single month.
- Averages hide the burden. A 7.74% food line is felt most by the households that spend the largest share of income on food, regardless of what the headline average says.
- Treat one print as one print. The September data is a snapshot released on 12 October — not a trend, and not a forecast.
For another plain read of the same kind of Indian data release, see how the monthly mutual fund numbers separate the headline from what households are actually doing with their money.
Sources
Cover image: BougainWell title card. All analysis and opinions in this article are BougainWell's own. This article is for general information only and is not investment advice.